

Week 10 Stats & Angles
Player Notes & Quick Hitters

Intro note:
Football is a matchup and indisoynrcatic game where teams change their behavior over the course of a season, players improve,and random results and injuries can skew outcomes that don’t necessarily reflect underlying value.
I personally find that so much of my success betting at this point in the season relies on sifting through the data to understand the sample sizes that are the most relevant/predictive going forward. Simply taking averages or medians can get you some of the way to good pricing, but I think it misses the mark and certainly so on the tails.
By taking an intensive look at our data and understanding the context in which it lives we can (hopefully) stay a bit ahead of the market. This column, then —which is an experiment for now, feedback appreciated— will look at some of the stats and angles I’m monitoring as I parse through the data and try to stay ahead of the market. I won’t capture everything and the structure and style is all in flux, but a start nonetheless. Let’s dive in.
Focused a bit on some QB stats I find intriguing as well as some team angles I’ll be monitoring. Again, this piece will be a work in progress so please let me know if you have some feedback and how I can make this better/change format etc.
Williams Inviting More Pressure?
We spoke last week about the Texans offense floundering given the amount of disruption and pressure the team gave up— Stroud was pressured on a whopping 55% of dropbacks against the Jets— but in many ways, the Bears offense has looked remarkably similar the past few weeks, as their pressure rates allowed have increased to 50% the last 2 weeks, after sitting at 33% the first 6 weeks of the season. And while the team has been dealing with some O-line injuries, that does not tell the full story.
Caleb Williams Time To Throw (TTT) has averaged about 3 seconds in the teams first 6 weeks of the season. But following the bye in Week 7, Williams TTT has been 3.35s, and 3.56s. And as a result, the rate of QB induced pressures—ie non disruption pressures— has increased from 21% the first 6 weeks to 30% the last two weeks. Williams non disruption pressures is averaging -0.97 EPA/Play. The increase from 21% to 30% at that rate of efficiency goes a long way in nuking overall production.
Lamar Having His Best Season?
While we are talking about QBs, let’s touch on Lamar Jackson and the Ravens. I would semi-joke the last few years that Lamar’s MVP candidacy is a direct reflection of how well his defense performs that year. But this year the Ravens D has been sketchy, yet he is overcoming it having his best season through the first half of this year. His EPA/Play & PFF Grade are career highs right now and with some margin. Choose your production stats and it will suggest that Lamar is having his best year.
But I bring up the production efficiency only to set the base. The interesting question to me is where is that increase in production coming from?
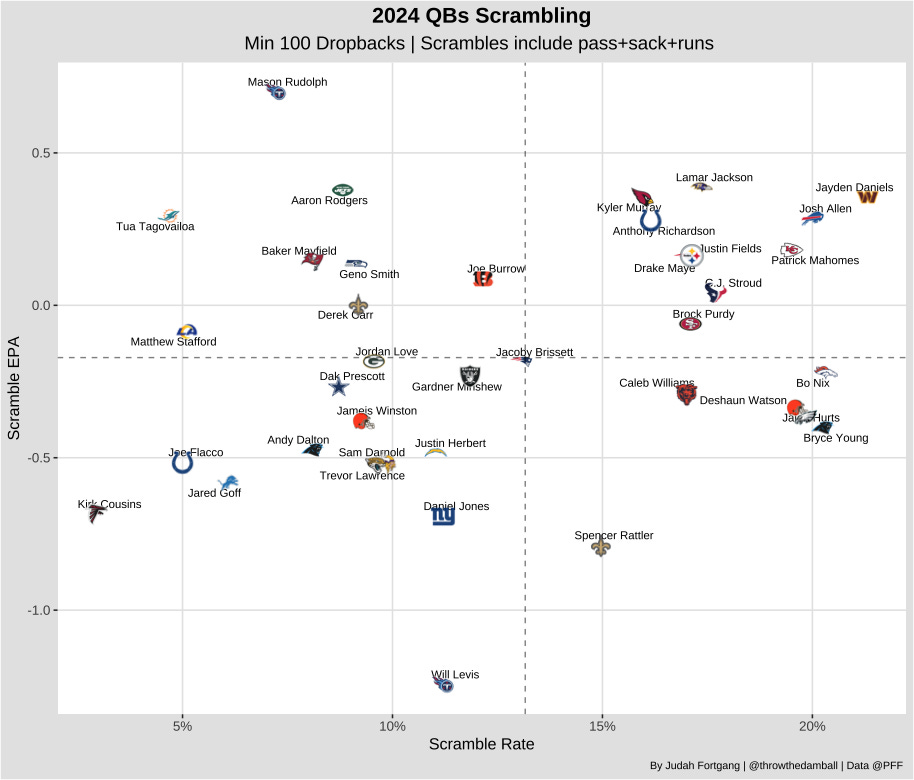
Lamar Jackson is having by far his best scrambling season this year with a 0.39 EPA/Play, compared to an average of -0.11 EPA/Play over the last 3 years. Perhaps you might say this is just variance.
But Jackson has also changed his style of play when scrambling which I think will remain directonally sticky. While the rate of scrambles hasn’t changed much—between 17-19% every season— in previous seasons, Jackson was running on nearly 45% of scrambles compared to only 30% this year. And Jackson has been far more successful on scramble throws than scramble runs. But perhaps more to the point is that Jackson’s willingness to hang in the pocket has also led to a massive decrease in sack rate on scrambles. Jackson’s sack rate sat has plummeted from a career average of 12% to 3% this year, leading to a massive bump in efficiency here.
Here’s another way of framing the last point: consider about how often an attempted run gets tackled short of the line for a sack. Jackson, though, has been far more selective in his scramble rushing attempts. And given his ability to evade the rush while still looking to throw, he has been able to stay in the pocket downfield longer— his time to throw after pressure arrives is by far a career high at 1.77s— giving more time for his receivers to get open and leading to a career best scramble pass EPA. So not only is Jackson eliminating far more of the negative plays by running less and taking fewer (sacks) but, given his pocket evasion capabilities, it is also creating more success on the scramble passing plays by committing more to the pass than the run.
Drake Maye
We are beginning to get some decent data on Drake Maye and his traits/ style of play. I think these are particularly relevant for understanding QB play + development and also how production can differ in particular matchups depending on a QBs traits.
Maye has shown a propensity to scramble and break the pocket this year where he has one of the higher scrambles rate in the NFL and one of the best scramble EPA as well. Maye
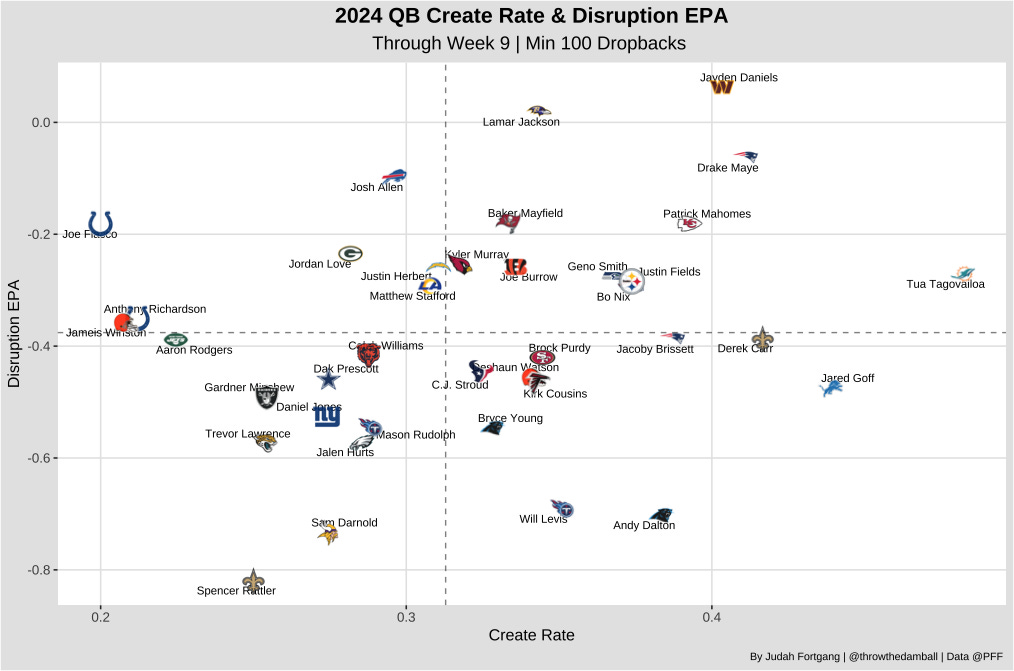
Breaking it down further and we see Maye have shown an even better ability to create when the play breaks down. His ability to create — defined as scrambles for positive expectancy or accurate throws to open windows— suggest that his production on scrambles is no fluke.
And his play against disruption generally, that is, plays with either perfect coverage or pressure that disrupts a play from ever developing is among the best in the NFL.
What does all this mean? According to our research above, this would suggest that, all else equal, Maye should be less bound to his situation than a typical QB, and through his ability to create and succeed against disruption, Maye can do a good job to mitigate good matchups. Now, the base rates of disruption “or situation” still matter— he’s 3rd best in the NFL under disruption but still losing expectancy on those plays— and the situation in NE is as bad as it gets. So this isn’t to say we should expect Drake Maye to start producing like Jayden Daniels, but 1) there will perhaps be some value to betting on Maye in spots where the market leans against NE given a defensive advantage (peep CHI this week) & 2) for the football nerd in me, Maye’s profile early on looks terrific and should the team improve on the O-line and in the WR room/scheme down the line, Maye has a chance to put up some terrific numbers and efficiency. Perhaps something to store in the LTM.
Rams D *eyes emoji*
I think it is time to have a conversation about Jared Verse. Verse is emerging not just as a good edge player, but one of the games very best.

Pressure can come in multiple forms-- pressure that disrupts a play from ever developing (X axis) and pressure which arrives later in the play after a QB was able to go through his reads (Y axis). And Verse is elite in both categories— one can just look at the names surrounding Verse here such as Nick Bosa, Micah Parsons, Myles Garett, and Aidan Hutchinson.
And the result over the last months have been far better for the Rams defense. And as we speak about often, it is one thing for a defense to improved over a 4 game sample with known quantities and a different one as teams improve in year 1 of a new scheme. Following their bye the team leads the NFL in disruption rate at 55%, is 2nd in pressure disruption rate, and at the top of the league in pressure rate, quick pressure rate, EPA/Pass allowed, etc.
The defense is still vulnerable to explosive plays allowing them at 12% clip over the past month . They are not without vulnerabilities, but the overall outlook for the defense has improved dramatically from pre-season and early season priors.
On the offensive side… on/off splits are generally noisy but general trends do not equally apply across the distribution. The Rams offense with Stafford/Kupp/Nacua/Williams on the field is averaging 7.5 Yards per play. That is 19% better than the 2nd place SF in that category. Add it up and the Rams are perhaps an intriguing team in general as well as in some futures markets with a very high ceiling.
Eagles D’ Emerging:
Speaking of defenses that improved in year 1 of a new defensive scheme, the Eagles defense has been dominant over the last month of the season despite playing some quality offenses. The team is best in the NFL over the last month in EPA/pass (-0.22), YPA (4.5) and at the top of the league in most other pass efficiency metrics. On the run defense side during this timeframe, the team is #1 in the NFL in rush success allowed and # 7 in EPA/rush.
But it is not just improvement over time in the new scheme for the Eagles, but some personnel decisions including Cooper Dejean beginning to start at CB where he holds the 2nd best PFF coverage grade (on ball) as well as some solid numbers preventing separation. The Eagles defense is getting improvement
Giants Abandon Passing Game
As the Giants pass protection has crumbled, so too, has their reliance on the passing game. The Giants passed at a neutral rate relative to expectation in their first game against the Eagles to the tune of 2 yards per play. But in the 2 weeks since, the Giants have passed 10% below expectation in each of their games.
Going long (got distracted with election night last night) so will end here.
As always, appreciate the support and spread the good word about throwthedamball! Will be back in the inbox soon as we get to the Week 10 games!
Would greatly appreciate a recap of the previous week's betting angles. What reads were right, wrong, and unlucky.