


Going to start with the longer form pieces here and we’ll be back with the full tails angles + SGPs tomorrow evening/night.
Be sure to check out some Week 11 Adrenaline Lined Up With Sean Lee & Zack Martin is live + some fun shorts on the YouTube page. (like and subscribe :) ) Also we’ve got a new episode of Throwthedamshow about to drop talking ball and Week 11 live angles with ball knower Ben Linsey.
Leveraging Tails
Many NFL bettors start with individual markets — spreads, totals or player props — and ask, “Which spread looks good?” or “Which totals stand out this week?” It’s a bottom-up approach: Start with the bet, then decide whether the underlying game script supports it.
In this space, we’ll work in reverse. Each week, we’ll focus on one game and take a top-down approach, starting with the broader picture of how the teams and players are performing and what the data suggests about the matchup. From there, we’ll identify the betting markets that best align with that expected game script.
The goal is to form a view of how the game is likely to unfold first, then find the spreads, totals and props that offer the best ways to bet on that outcome. And while we can’t walk through this full process each week this should provide a window into how to build a process to beyond the logic for this game and matched with ones own opinions.
NYG ML + alt spreads
Note: It’s possible there’s some weather here, though I’m seeing some conflicting forecasts on Friday and will for now assume weather will not be a major factor. Of course, we can take a closer look as we get closer.)
Let us begin, as usual, by setting the frame for our analysis and looking at the team fundamentals to understand the markets implied projection. Here we have a look at EDP (Earned Drive Points) which quantifies a drive’s quality on a points per drive basis, as determined by how repeatable and sustainable the success on a drive was.
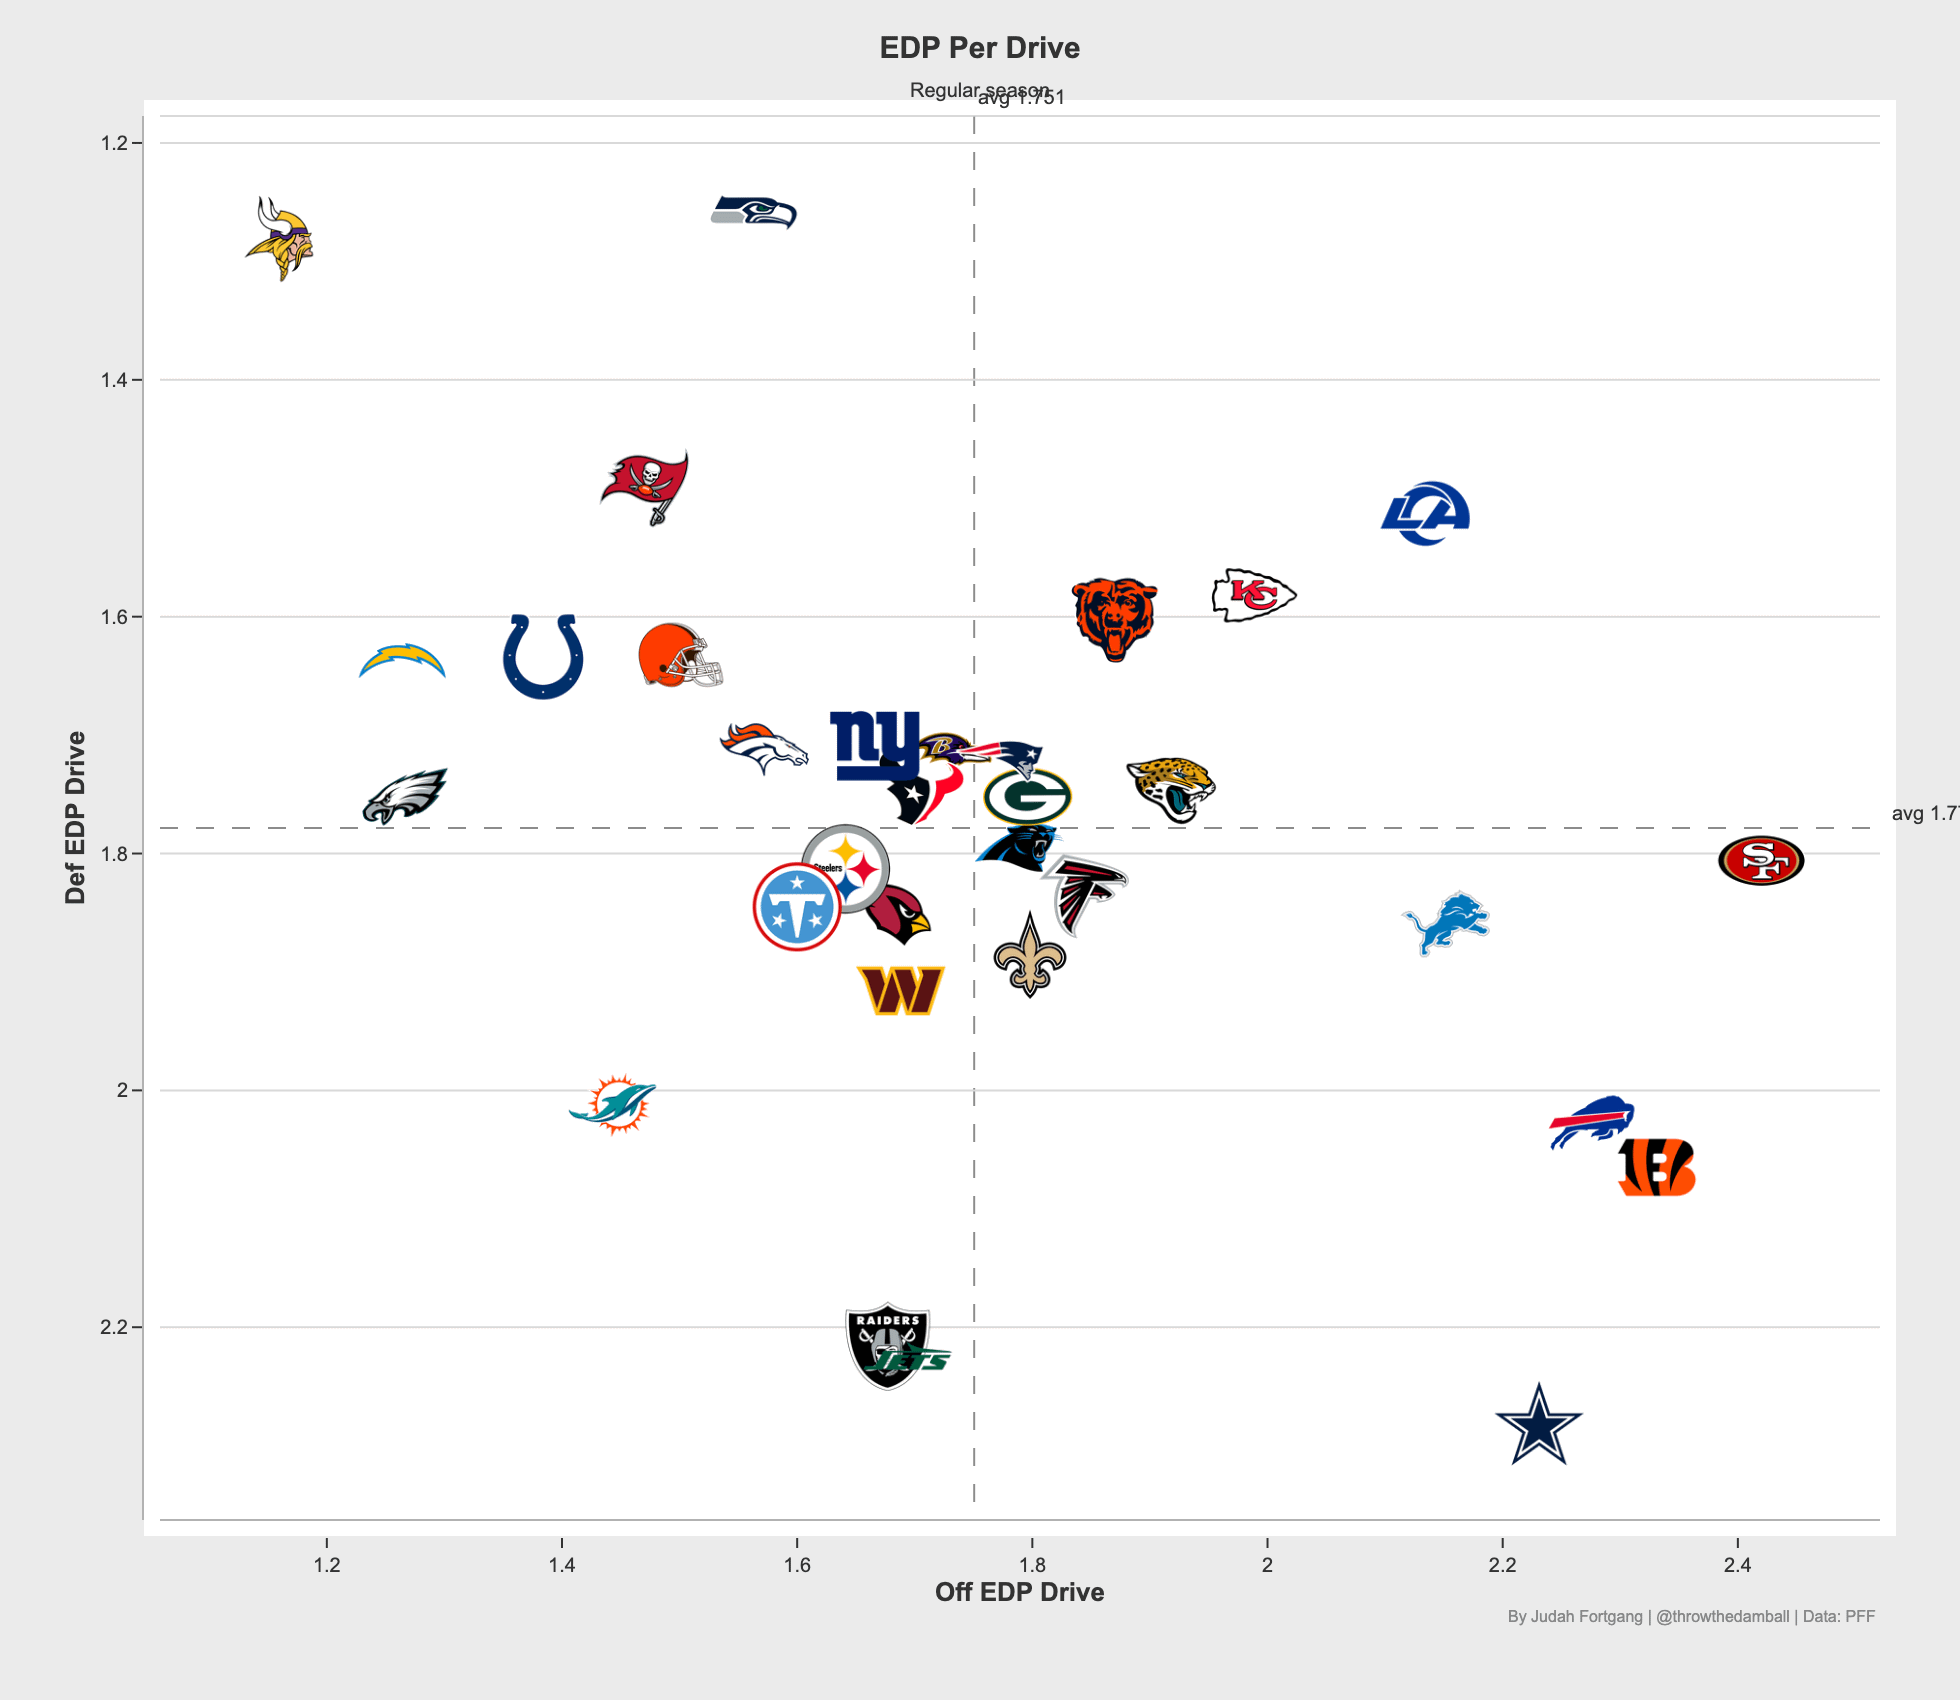
And interestingly we see here the Jaguars as a better team here but they and the Giants are in the same cluster with JAX about 0.4 points more productive on offense and about equal on defense. And that is a pretty stark contrast to some of the other efficiency numbers such as EPA chart here.
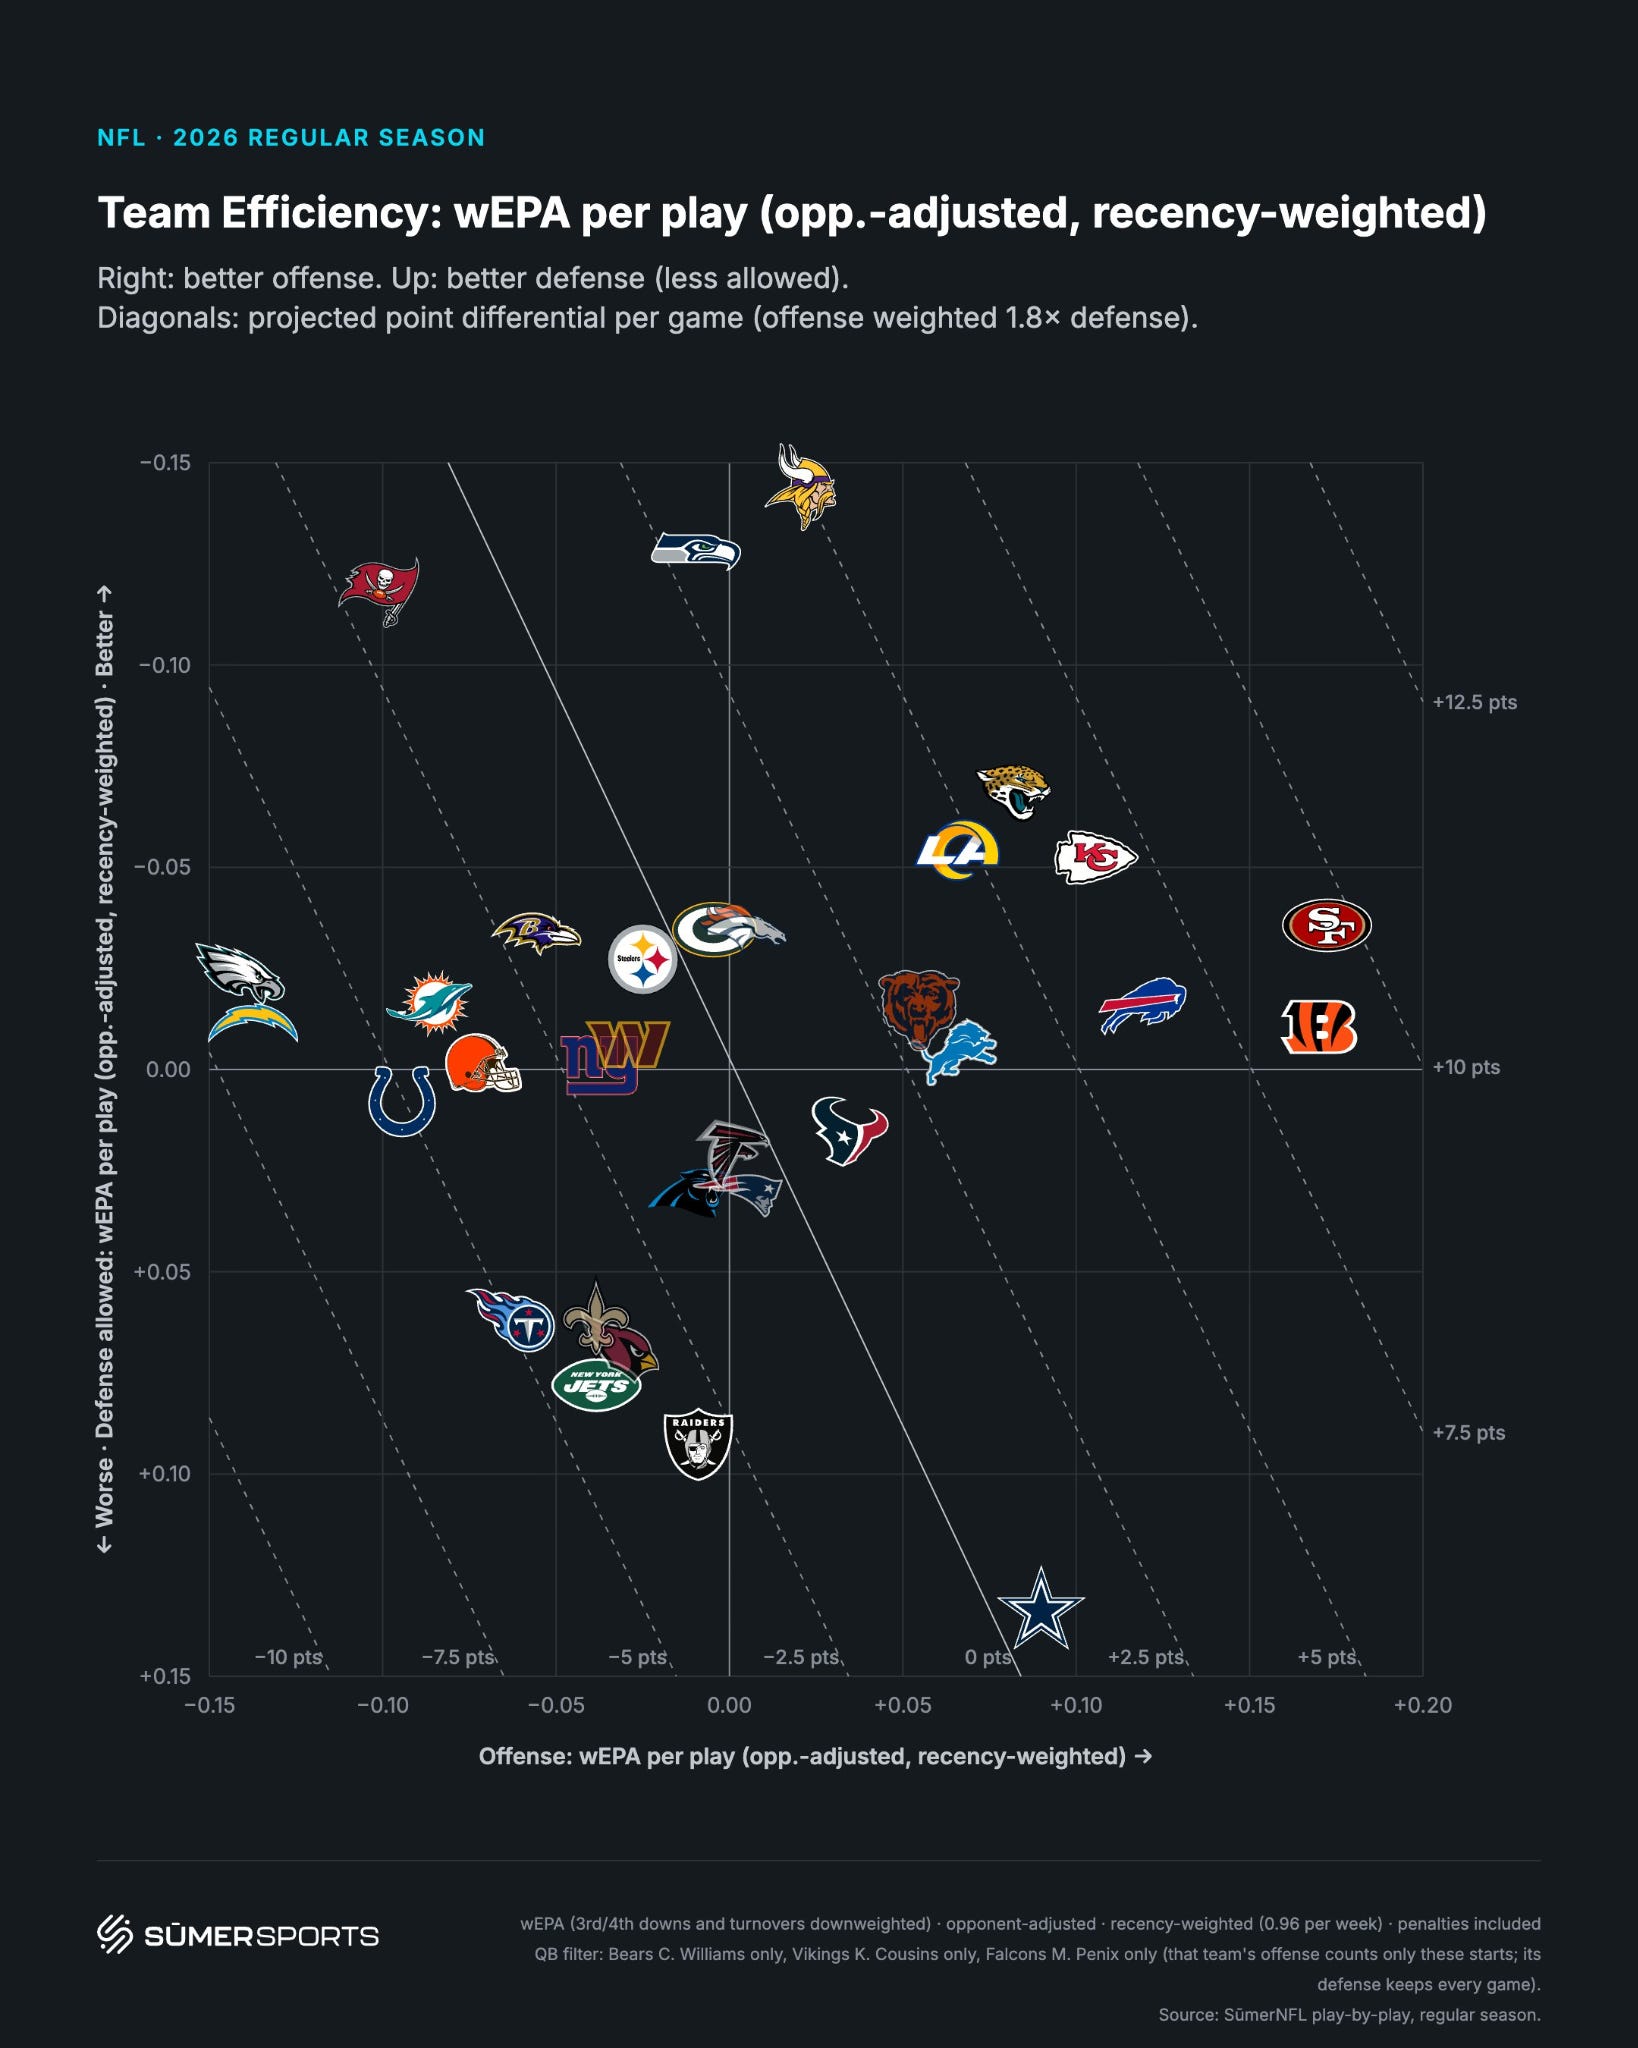
On an EPA/Play basis this is a Jaguars defense and offense that has been far more productive than the Giants. And from this efficiency standpoint, the Jaguars being implied as 7.5 point favorites makes a bit more sense. This chart here would suggest about a 5 point gap from an efficiency standpoint, so there’s an argument along on the Giants end from that alone with the market assuming a ~7.5 point difference accounting for home field.
But the more interesting question, I think, is what EDP is getting at relative to EPA. And how that difference makes Giants intriguing combined with how the teams have evolved over the season and the different matchup angles that might suggest some value on the NYG tails.
On the defensive side, much of the difference in production on the Jaguars comes from turnovers where the Jaguars are 2nd in EPA gained at 82 points (the Giants are at 45). Excluding turnovers, these defenses are 8th and 10th at 0.07 and 0.05 between the Jaguars and Giants respectively. This isn’t to fully discount JAX forcing turnovers, but on a down-to-down basis these defenses have actually been roughly similar.
And it is also worth mentioning on the Giants side, that defense made a fundamental philosophical change coinciding with starting CBs Deonte Banks’ return from injury. The Giants began playing a more man-heavy blitz scheme, blitzing on more than 50% of their plays starting in Week 4, up from 30% for the first few weeks. The result is a team that is 4th in quick pressure rate in that span since, while unlocking Arvell Reese as a pass rusher where he went from rushing the passer on 20% of the snaps to 45% of the snaps since week 4. And the run defense as well has performed far far better off the run blitzes.
