Thinking Through Time To Throw & ADOT
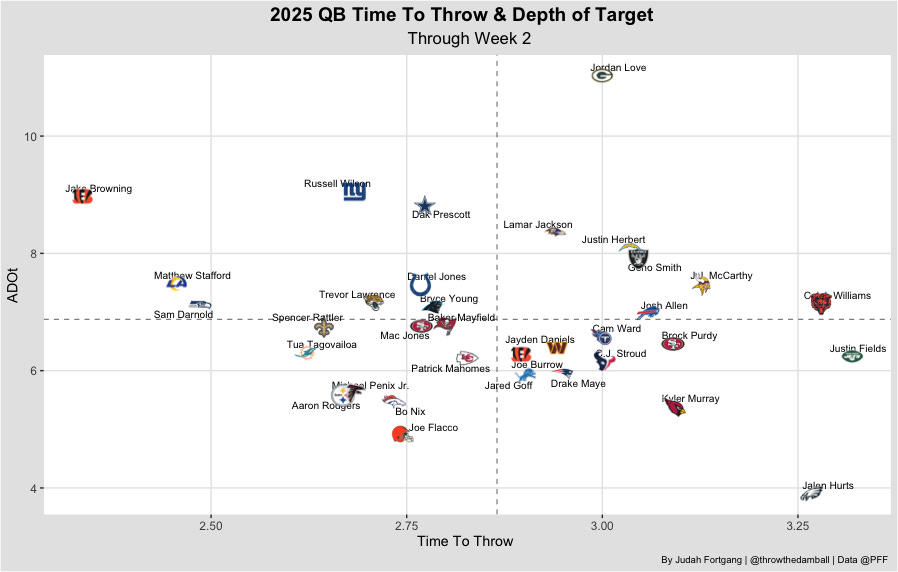
I posted this aDOT vs TTT graph last week without commentary, and it blew up. Reading through the comments, I saw a wide variety of interpretations and figured I’d walk through my process in how I approach data like this.
My goal, as always, is to help the regular football fan and bettor become more engaged in the sport through understanding the data and intricacies underlying the game. In doing so, we will enjoy the game we know and love more, while hopefully making good money in the process.
Let’s take this graph as an example.
It tracks how long a quarterback takes to throw the ball (“time to throw”) and how far, on average, he throws it (“aDOT”). Without more context, the graph doesn’t tell us anything meaningful about production, or how *good* the QB is. For example, does a longer time to throw reveal more about the quarterback or the offensive line? Well it depends!
Therefore, rather than jumping to quick conclusions on outliers (ie, “Jalen Hurts sucks bro”), I’d begin by trying to contextualize the graph.
Here are some of the guiding questions I would ask myself:
1. A high time to throw means a play has more time to develop, either via good o-line protection or a QB extending the play. Is a longer TTT a trade off that leads a given QB to take more sacks? Does it lead to more explosive plays? How does this influence the player's stat distribution or the team's distribution?
2. Is the QB holding the ball for too long because his receivers aren’t open? That might teach us more about the receivers and scheme than the QB
3. Is a players aDOT low because they’re throwing tons of screens and the average isn’t as revealing as the average is to an ordinary player? This may indicate something deeper about schemes and matchups rather than a QB's capabilities
With these questions in mind, here's how I would apply this type of thinking:
When I look at this this graph, Jalen Hurts certainly stands out as a huge outlier. Let's dig a bit deeper into his data.
To begin, his depth of target is 2 yards lower than it was last year despite having the same time to throw. This comes along with a dramatic reduction in his sack rate, which, through 2 games, is down to 4% from 9% last year (bottom 5 in NFL last year). And we see this in particular when he's scrambling: Hurts's aDOT when scrambling has gone from 4 yards to 0.25 yards.
Now, of course this is a small sample and it’s possible this is matchup specific or a function of gameplan. But I think more likely is that Hurts is exercising a trade-off where he is avoiding more sacks by throwing check downs but taking fewer risks downfield resulting in a lower depth of target.
Is this trade-off good or bad? Trick question. The point is evergreen here: there is little in football that is to be understood in absolutes. Trade-offs are the name of the game.
Hurts has been minimizing bad plays (sacks) at the expense of the upside of potential explosive plays. Could that be because the Eagles were huge favorites against Dallas in Week 1 and that trade off made more sense? Could it be a new style of play that is likely to continue? Or simply just outliers?
When I look toward betting the Eagles in the upcoming weeks, these are the questions I will continue to ask myself.
Unpacking this signal from the data is how we enhance our understanding of the game and the trades-offs that underlie it, while trying to beat markets to information to generate returns.
If you guys want to see more content like this going forward, please let me know. As always, appreciate the support and spread the good word about Throwthedamball! Will be back in the inbox for part 1 of the Betting Gameplan tomorrow.


Love to learn this information
Yes! This is the exact type of content that is both valuable and s interesting