

What is Create Rate?
How different QBs win and why it matters

This post is the first in a series where I dive deeper into my favorite stats that inform my betting strategies.
A note here about the goal of this series: As many of you know, I started betting as a result of the research I was doing as a football nerd working on some data projects. I developed stats that helped me understand the game better than anything I found publicly available, and then tested my theories through betting based on my research.
That background still shapes how I think about the game and my bets and trades — always looking to understand what the market is pricing in and what information is lacking.
The market is sharp, of course, but it is not without leaks and holes. Football is a complex game with limited data and 22 people interacting simultaneously on the field. Sifting through the noise and studying those interactions appropriately can yield massive rewards. That is, even if everyone has access to the same stats and information, that doesn’t mean everyone will interpret them or manipulate them the same way.
This series will look at some of the data I’ve generated and referenced throughout this newsletter. Because I regularly cite these stats in my analysis, this series will eventually become a glossary worth revisiting to better understand my weekly analyses.
Truth be told, however, that is only a part of the goal here.
What I hope to do in this series is provide a window from 0-1 of how I take football information, fulfill the football-nerd-in-me’s desire to understand the game better, and then apply that to betting in the game theory context of a marketplace.
And like anything we do at Throwthedamball, at a high level, the goal is to provide a process that you can ingest on your own and apply it to how you think and understand (and trade) on the game we all love.
Create Rate:
Create Rate measures the process by which a QB succeeds when facing a disruptive situation.
A disruptive situation here is defined as:
plays when pressure comes so quickly that a QB has to abandon his read to avoid pressure
AND/OR
plays in which every coverage defender is guarding their man well (disruption will be its own post).
Most QB stats focus on post-facto results, like TDs or INTs. However, these metrics do not sufficiently filter out the noise that emerges from looking solely at post-facto results. Things like the randomness a QB can’t control, such as a dropped pass leading to an interception. These stats are inefficient ways of measuring a QBs success (or likelihood of future success).
Create Rate instead captures the process by which a QB attacks—and his rate of success—disruption. And like most process metrics, this is a more indicative and repeatable way to predict outcomes in future disruptive situations.
What is the definition?
Create Rate captures how often a QB throws an accurate pass to a receiver/”throws open” a receiver, OR scrambles for positive expectancy (a result they have the most control over) in disruptive situations.
What is perhaps more interesting than the simple predictive value is what create rate teaches us about the nature of a QB's skills and play styles, and the trade-offs and multiple ways that that player can succeed.
Football is a game of trade-offs. Consider obvious examples like a QB holding onto the ball for a long time in the pocket. It is neither good nor bad but rather a trade-off. In this case, high time-to-throw (TTT) increases the likelihood of a sack, while also increasing the likelihood that a receiver gets open with more time to run his route.
Evaluating that trade-off is tied to an understanding of play style— Patrick Mahomes will have an easier time buying time for himself than Matthew Stafford will. Every QB always needs to optimize the trade-off given the particular situation, whether that be constraints on skill and/or the matchup they face.
This leads us to our chart here on Create Rate and how it helps us understand QB play more broadly.
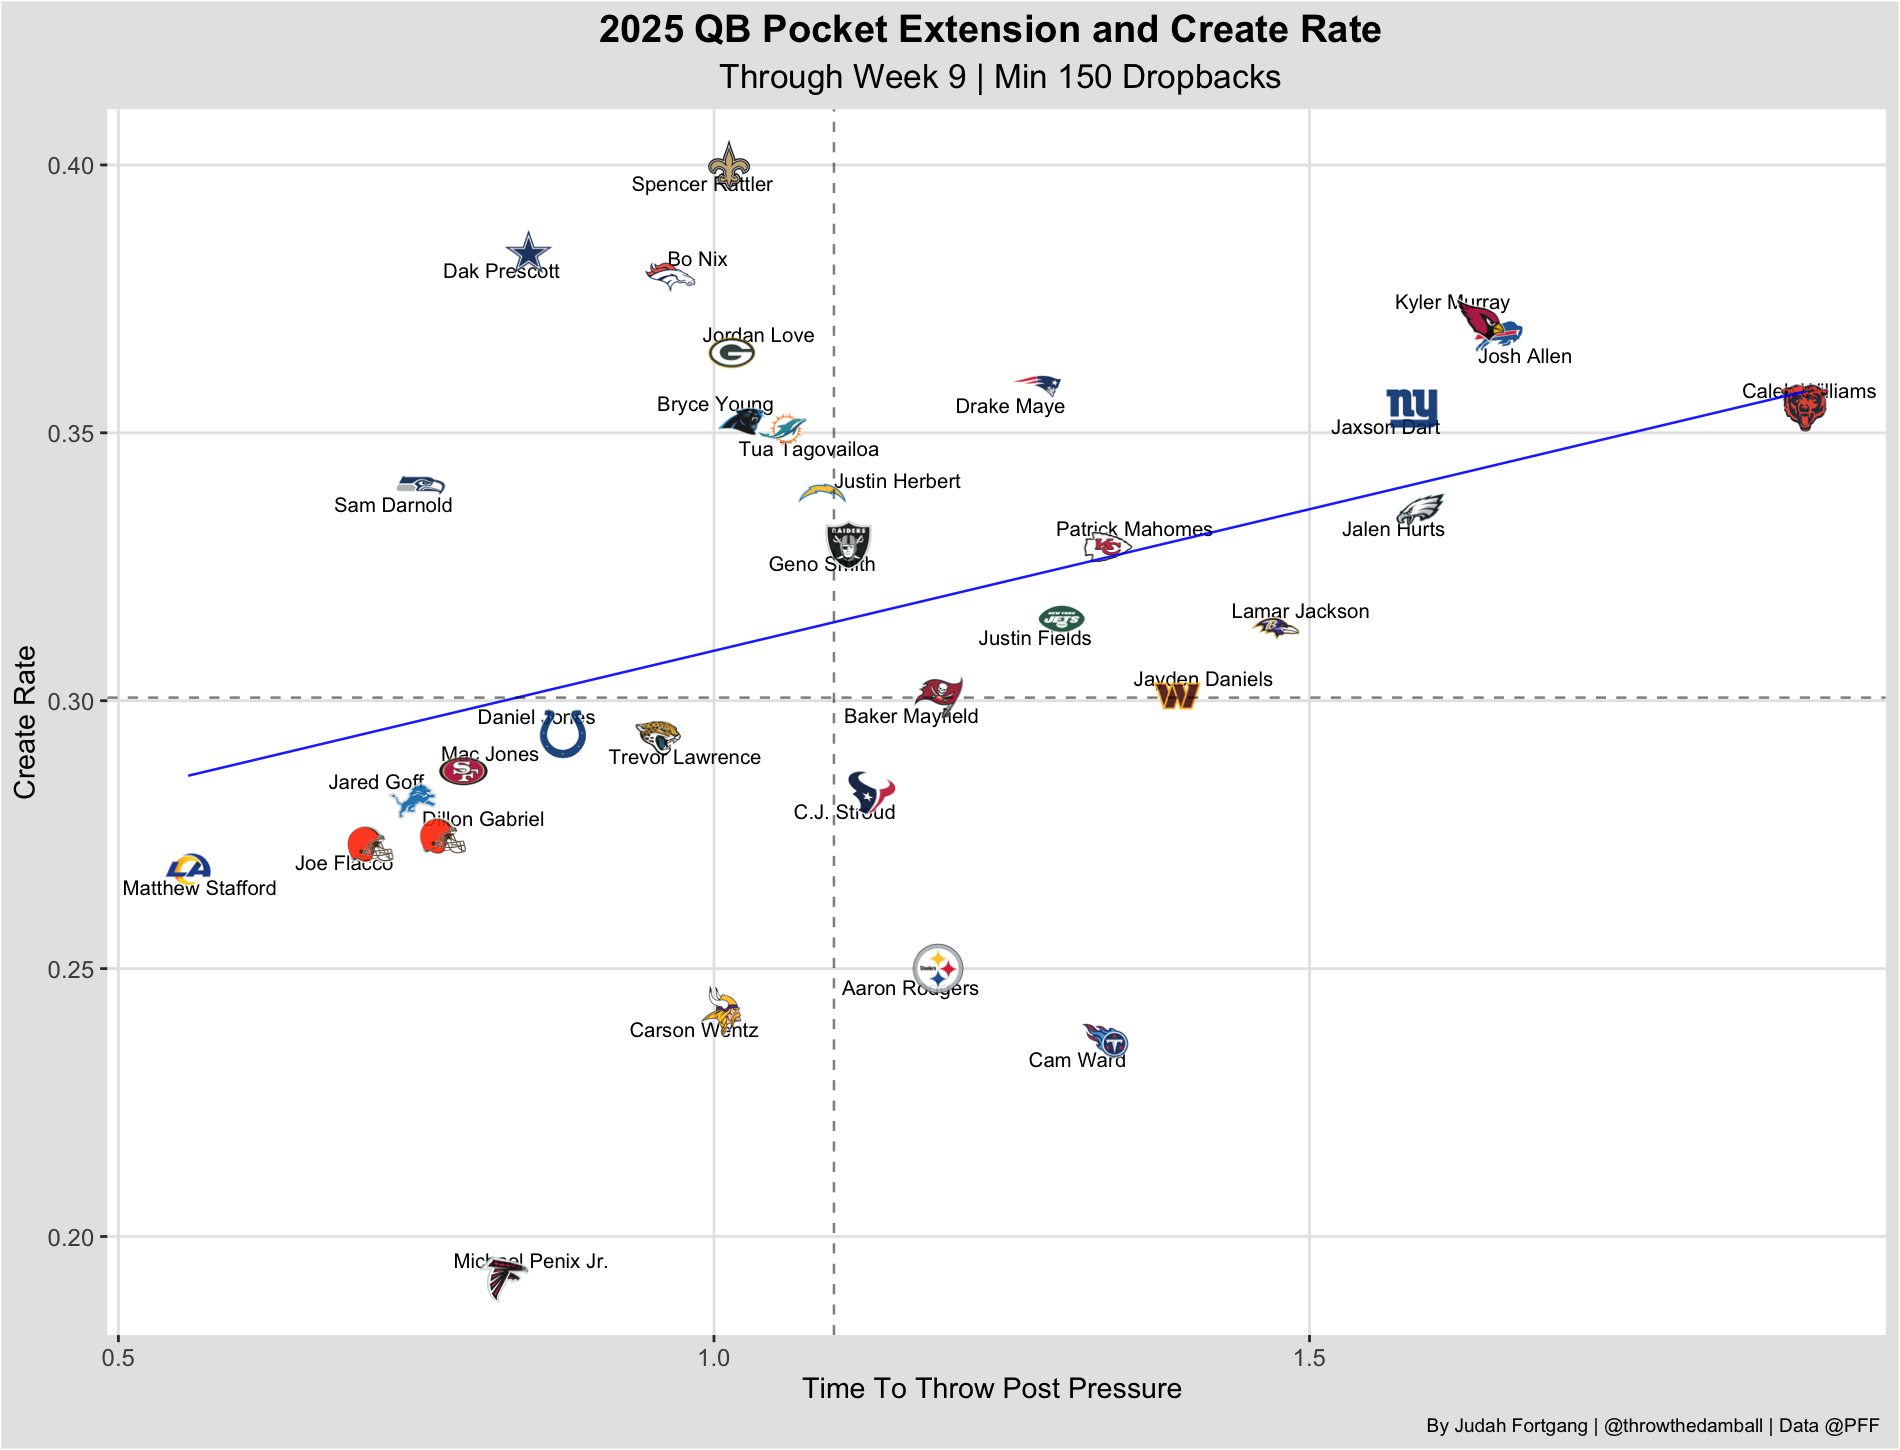
On the Y axis we have our create stat we defined above. What this chart captures on the X axis “Pocket Extension,” is how long a QB, on average, extends plays once pressure arrives in disruptive situations.
One would assume that this is the easiest path to the ability to create. And they would be right in so far as there is a clear linear relationship between the ability to extend plays and the ability to create.
But simply extending plays is not dispositive of success—a QB still needs to execute a good throw and/or have the scrambling ability to succeed. Perhaps more to the point, this chart reveals the different ways a QB can succeed and create from within the situation.
Case Studies: Dak and Mahomes
Let’s use Dak Prescott and Patrick Mahomes as examples. In the above chart, Prescott stands out in his ability to create, while ranking on the shorter end of Pocket Extensions among NFL QBs. On the other hand, Mahomes extends plays well past league average. Both Create at high levels, but they win in different ways.
Dak’s ability to Create lies in his ability to deliver an accurate ball to a receiver who wasn’t otherwise open, as illustrated in the chart below.
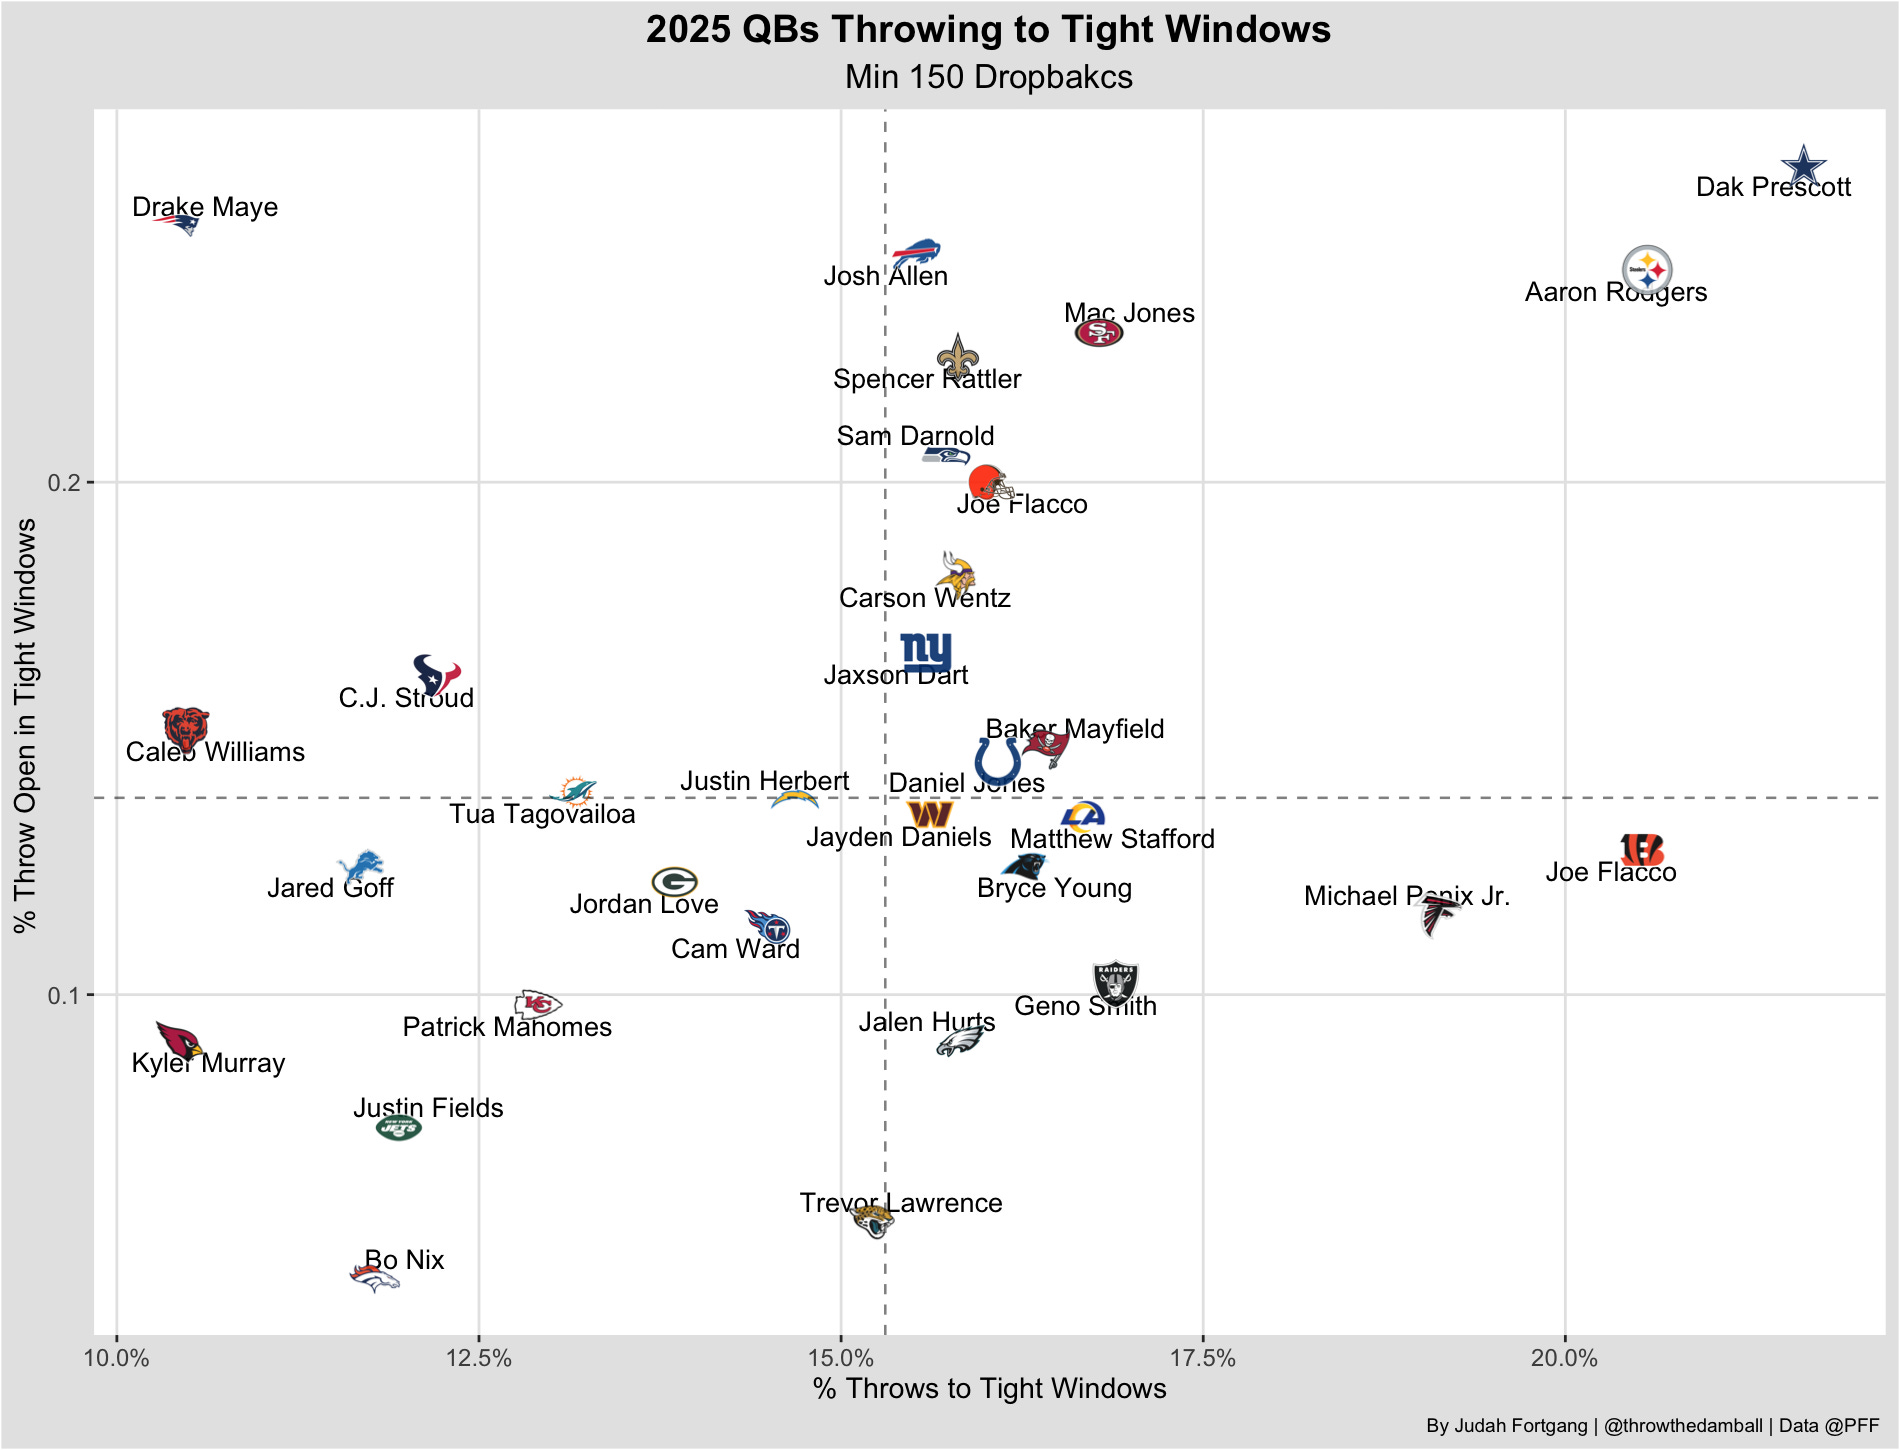
This chart shows how often a QB throws into a tight window and, on those throws, how accurate the passes are. In effect, the accurate ball diminishes the tight window and thereby “throws the receiver open.” Dak is league-best in tight window throws and, therefore, unsurprisingly, attempts them quite often.
Here is an example clip (my video editing skills aren’t great, deal with itttt):
The coverage on this play is tight across the board, and Prescott here creates by engineering a near-perfect throw (despite Pickens not making the play).
Here’s where trade-offs come in: Dak has the skill to make these throws and, therefore, can make the trade-off to not scramble because he has this skill in his bag. If a QB like Justin Fields were to attempt most of these throws, the results would likely be very different. That is why Fields opts for a different approach to creating.
Meanwhile, Mahomes’s ability to create is a much different style. Mahomes is elite at extending plays and subsequently creating open windows by virtue of the play extension.
Consider this example from earlier in the season where Mahomes anticipates the rush and maneuvers the pocket, forcing the linebacker into a conflict and creating an open window for a first down. His creation lies in his manipulation of the pocket and his ability to engineer throws to receivers not previously open.
The football nerd in me finds this interesting on its own in understanding how the game works and how players execute trade-offs to win in particular situations.
The researcher/trader in me also sees this as a spot to understand the interaction: How might a Mahomes-style of creation interact with a particular matchup relative to a Prescott-style of creating?
The Prescotts of the world can win against good coverage, mitigating those teams that win on defense via their coverage.
For Prescott, a matchup, say, with the Eagles defense, who are among the league’s best at preventing separation, is far less daunting. That isn’t to say Prescott would be guaranteed to carve them up, just that the base rate of the Eagles secondary is mitigated slightly in this matchup interaction. We saw this in action in Week 12 when Dak lit up the Eagles D for 354 yards and 2 passing TDs (+ 1 rushing TD). I wrote about it before the game in my weekly gameplan here.
For the Mahomeses of the world, this play-style neutralizes pass rush as well as coverage, though the effect on each is less pronounced.
For Mahomes, a matchup with a team like the Steelers is perhaps the ideal spot for this matchup effect. The Steelers generate so much of their defensive efficiency via the pass tush and generating quick pressure. But Mahomes’ ability to scramble out and Create leaves the rest of the defense exposed for Mahomes to take advantage.
Of course, each is a spectrum, and the style of play also interacts with how good a player is at the Creating skill.
As always, there is more to say and more research to do, which is part of the fun in analytics and interacting in a marketplace. For now, this hopefully gives a taste of the process of data and provides some quantification of a skill we all notice when watching the games.
Questions/Comments/Feedback always appreciated, and we’ll be back in the inbox with more in this series as well as the regular Betting Gameplan.
This was awesome! I would be interested in hearing more about how you are calculating create rate. Or even your discussion and decision-making on weighing different variables if that was applicable.
Maybe you guys can help me out a bit here. What does
“ ‘throws open’ a receiver ” mean?